Ruby clone of GrowthForecast
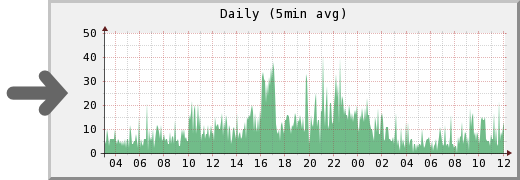
Focuslight is a web tool that let's you graph all sorts of metrics via a WebAPI. Our simple API let's you create and update charts in real time, customize your charts through a Web interface, and create charts that combine multiple metrics.
You can graph your MySQL data with 1 line of code
$ crontab -l
*/5 * * * * curl -d number=`mysql -BN -e 'select count(*) from member' game` http://example.com/api/socialgame/member/register 2>&1 | logger -t post_gf -p local0.info
By periodically POSTing to Focuslight with cron, you can make charts without having to deal with complex settings
Installing and Booting
(1) Installing Package Dependencies
We'll first install the libraries that RRDTool depends on using package managers like yum, apt, homebrew, etc.
- glib
- xml2
- pango
- cairo
CentOS
$ sudo yum groupinstall "Development Tools"
$ sudo yum install pkgconfig glib2-devel gettext libxml2-devel pango-devel cairo-devel
Ubuntu
$ sudo apt-get build-dep rrdtool
(2) Installing Focuslight
We'll use the bundler command to install Focuslight together with its module dependencies.
We recommend that you use Ruby built with rbenv (or others) rather than the default Ruby that ships with your OS.
$ git clone git@github.com:focuslight/focuslight.git
$ cd focuslight
$ gem install bundler
$ bundle install
$ bundle exec rake init
Installation will take a bit of time since there are a many gem dependencies.
(3) Starting Focuslight
You've now installed Focuslight! To start Focuslight, please execute "bundle exec foreman start".
The web server will start on port 5125. You can verify this in your browser.
Boot Command
$ bundle exec foreman start
Configuration
To configure Focuslight, edit the `.env` file in the project root directory.| ENV Name | Description |
|---|---|
| DATADIR | The directory to store the graph data. Default: ./data. |
| PORT | The TCP port to bind to. Default: port 5125. |
| HOST | The IP address to bind to. Default: 0.0.0.0 |
| FRONT_PROXY (not supported yet) | If using reverse proxy, uses the IP address of the reverse proxy or CIDR. Multiple IP addresses can be set |
| ALLOW_FROM (not supported yet) | Specify the IP address from which the service can be accessed. If not set, the service can be accessed by all remote hosts. |
| 1MIN_METRICS (not supported yet) | Stop the service from updating the graph every minute. |
| FLOAT_SUPPORT | Accept to post floating numbers. Defautlt: n (Accept only interger numbers) |
| DBURL | Database URL such as sqlite://data/gforecast.db for SQLite, or mysql2://root:@localhost/focuslight for MySQL. Default: sqlite://data/gforecast.db |
| RRDCACHED (not supported yet) | Specify rrdcached address. Format is like unix:</path/to/unix.sock>, or <hostname-or-ip>:<port>. Default: no |
| MOUNT (not supported yet) | Provide Focuslight under the specified url path. Default : / |
| LOG_LEVEL | Specify log level. Either of debug, info, warn, error, or fatal. Default: info |
If Using MySQL
You will need to create a database, and add the following permissions when using the MySQL.
- CREATE
- ALTER
- DELETE
- INSERT
- UPDATE
- SELECT
Expamle of Commands
mysql> CREATE DATABASE focuslight;
mysql> GRANT  CREATE, ALTER, DELETE, INSERT, UPDATE, SELECT \\
         ON focuslight.* TO 'user'\@'localhost' IDENTIFIED BY password;
Your username and password are set by DBURL parameter on .env file or system environment variables.
DBURL=mysql2://user:password@localhost/focuslight
Basic Usage
How to Register Graphs
To create graphs or update data, make a request to the following URL via a POST method.
http://example.com/api/:service_name/:section_name/:graph_name
The names of the items within the URL to POST to are shown in the table to the right.
You can use multi-byte strings for each item name as long as it is UTF-8.
| The Name Used in the Example | Purpose | Actual Parameters |
|---|---|---|
| :service_name | The name of the service that you'd like to graph | blog, photo, place, socialgame |
| :section_name | The name of the feature or system to graph, within said service. | entry, user, spot, items |
| :graph_name | The actual name of the value being graphed | total_entry, kakin_user, muryo_user |
For example, if we are graphing the number of registered users in a social game, we would POST to the following URL:
http://example.com/api/socialgame/member/register
Also, we would use the following parametens when POSTing.
| Parameter | Description | Required/Optional |
|---|---|---|
| number | The number to give the graph | Required |
| mode | Update method for the number: count, modified, gauge。 count: Add the value of the number parameter to the pre-registered value. modified: Overwrite if the value differs from last time. gauge: Always overwrite with the value of number Default: gauge mode |
Optional |
| color | The color of the grah. Specify with #FFFFFF format. | Optional (auto-generated if unspecified in a new graph) |
Example: Creating a New Graph
Using curl:
$ curl -d number=10 http://example.com/api/socialgame/member/register
Other API
Customizing the Graph's Appearance
You can customize the graph's appearance by adding a few parameters to the graph's URI.
Endpoint
URI of a Graph     http://example.com/graph/:service_name/:section_name/:graph_name
URI of a Compound Graph http://example.com/graph/:pattern
List of Supported Parameters
You can even make graphs like the one below just by changing the parameters!
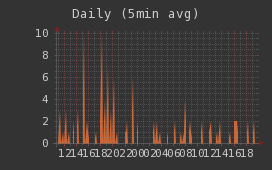
http://example.com/graph/service/section/graph?t=d&border=0&legend=0&width=200&background_color=333333&canvas_color=333333&font_color=CCCCCC&axis_color=666666
| Parameter | Description |
|---|---|
| t | The range of the graph: y(1 year), m(1 month), w(1 week), 3d(3 days), s3d(3 days, refresh every minute), d(1 day), sd(1 day, refresh every minute), 8h(8 hours), s8h(8 hours, refresh every minute), 4h(4 hours), s4h(4 hours, refresh every minute), h(1 hour), sh(1 hour, refresh every minute), n(half a day), sn(half a day, refresh every minute), c(custom)、sc(custom, refresh every minute) |
| from | When `t` is set to `c` or `sc`, this value sets the start time of the graph. Uses the format: 2011/12/08 12:10:00 |
| to | When `t` is set to `c` or `sc`, this value sets the end time of the graph. Uses the format: 2011/12/08 12:10:00 |
| width | The width of the graph. (The actual width is a bit wider due to the Legend and other elements) |
| height | The height of the graph. (The actual height is a bit higher due to the Legend and other elements) |
| graphonly | This mode only plots the graph. No other elements are plotted. Default: 0 |
| logarithmic | Graphs in logarithmic scale. Default: 0 |
| xgrid | Setup for the X-axis. Details regarding the format can be found in the rrdtool documentation. |
| ygrid | Setup for the Y-axis. Details regarding the format can be found in the rrdtool documentation. |
| background_color | Background color. Specify using the FFFFFF or FFFFFF00 formats (last 2 characters are for the alpha channel). |
| canvas_color | The canvas (background) color of the graph. Specify using the FFFFFF or FFFFFF00 formats. |
| font_color | The font color. Specify using the FFFFFF or FFFFFF00 formats. |
| frame_color | The frame color of the Legend. Specify using the FFFFFF or FFFFFF00 formats. |
| axis_color | The border color of the graph. Specify using the FFFFFF or FFFFFF00 formats. |
| shadea_color | The border colors for top left and top. Specify using the FFFFFF or FFFFFF00 formats. |
| shadeb_color | The border colors for bottom right and bottom. Specify using the FFFFFF or FFFFFF00 formats. |
| border | The thickness of the borders. `0` is a valid value. Default: 3. |
| legend | Enable the Legend (including summary data of the graph). Default: 1 |
| sumup | Include the sum value in the Legend. Default: 0 |
Graph Data Summary
You can export the Legend information (which includes the summary data of the graph) in JSON format.
Endpoint
URI of the Graph Summary    http://example.com/summary/:service_name/:section_name/:graph_name
URI of the Compound Graph Summary  http://example.com/summary/:pattern
Exporting Graph Data
You can export your graph data in JSON format.
Endpoint
URI of the Graph http://example.com/xport/:service_name/:section_name/:graph_name
URI of the Compound Graph http://example.com/xport/:pattern
List of Parameters
| Parameter | Description |
|---|---|
| t | The range of the graph: y(1 year), m(1 month), w(1 week), 3d(3 days), s3d(3 days, refresh every minute), d(1 day), sd(1 day, refresh every minute), 8h(8 hours), s8h(8 hours, refresh every minute), 4h(4 hours), s4h(4 hours, refresh every minute), h(1 hour), sh(1 hour, refresh every minute), n(half a day), sn(half a day, refresh every minute), c(custom)、sc(custom, refresh every minute) |
| from | When `t` is set to `c` or `sc`, this value sets the start time of the graph. Uses the format: 2011/12/08 12:10:00 |
| to | When `t` is set to `c` or `sc`, this value sets the end time of the graph. Uses the format: 2011/12/08 12:10:00 |
| width | Maximum number of rows. |
Related Softwares
Focuslight is a Ruby port of GrowthForecast having HTTP API compatibilities. Therefore, following client software for GrowthForecast should work for Focuslight, too
fluent-plugin-growthforecast
https://github.com/tagomoris/fluent-plugin-growthforecast
Fluentd plugin to output numbers(metrics) to 'GrowthForecast', metrics drawing tool over HTTP.
rb-growthforecast (ruby)
https://github.com/tagomoris/rb-growthforecast
Client library and command to operate GrowthForecast
growthforecast-client (ruby)
https://github.com/sonots/growthforecast-client
growthforecast-client is a ruby client library for GrowthForecast API where GrowthForecast is a visualization graph tool.
Net::GrowthForecast (perl)
https://metacpan.org/pod/Net::GrowthForecast
A client library for awesome visualization tool GrowthForecast